数据挖掘实践——基于简单线性回归模型的数据仓库存储增长预测
Introduction
This dashboard is built to help data warehouse administrators to monitor and forecast system storage before the end of 2015-06-30.
Calculation
Collect sample data
The sample data is collected from 2014-07-01 to 2014-12-31.
Create mathematical model
We use Simple Linear Regression model to calculate the storage forecast line.
We assume a model
Y=β0+β1X+ε
where β0 and β1 are two unknown constants that represent the intercept and slope, also known as coefficients or parameters, and ε is the error term. Given some estimates β0’ and β1’ for the model coefficients, we predict future storage using y’=β0’+β1’x where y’ indicates a prediction of Y on the basis of X=x, The ‘ symbol denotes an estimated value.
Estimation of parameters base on Least Squares approach
    β1'=∑(X - ¯X)(Y - ¯Y) / ∑(X - ¯X)2
       =(∑XY - n¯X¯Y) / (∑X2 - n¯X2)
       =(∑XY - (∑X)(∑Y)/n ) / (∑X2 - (∑X)2/n )
    β0'=¯Y-β1'¯X

    ¯X=Avg(X)=(∑X)/n
    ¯Y=Avg(Y)=(∑Y)/n
So we only need to calculate X2, XY, and then ∑X=sum(X), ∑Y=sum(Y), ∑X2=sum(X2), ∑XY=sum(XY). SQL is enough to handle it.
Confidence Interval
That is, there is approximately a 95% chance that the interval [β1' - 2•SE(β1'), β1' + 2•SE(β1')] will contain the true value of β1.
    β1''=β1' ± 2•SE(β1')
    β0''=β0' ± 2•SE(β0')
We have
SE(β1’)2=σ2/∑ni=1(Xi-¯X)2,
SE(β0’)2=σ2[1/n + ¯X2/∑ni=1(Xi-¯X)2]
where σ2=Var(ε)
Query Text
--delete from  support_scratch.storage;
--drop table support_scratch.storage;

CREATE TABLE support_scratch.storage AS
(SELECT ROW_NUMBER() OVER(ORDER  BY a.thedate) AS RowNum,
thedate as TheDate,
CAST(SUM(coalesce(currentperm,0))/1024/1024/1024 AS DECIMAL(18,2)) AS CurrentPermGB
FROM dw_monitor_views.DatabaseSpaceHistory a
join access_views.DW_CAL_DT b
on a.thedate=b.cal_dt
where b.age_for_month_id between -6 and -1
GROUP BY 2
)WITH DATA PRIMARY INDEX (thedate) ;

select * from support_scratch.storage;
delete from  support_scratch.storage1;
drop table support_scratch.storage1;

create table support_scratch.storage1 as
(select  a.RowNum as X
, a.TheDate
, a.CurrentPermGB as Y
, a.RowNum*a.RowNum as X2
, a.RowNum*a.CurrentPermGB as XY
from support_scratch.storage a
)WITH DATA PRIMARY INDEX (thedate) ;

--select * from support_scratch.storage1;
--delete from  support_scratch.storage2;
--drop table support_scratch.storage2;

create table support_scratch.storage2 as
(
select  sum(a.X) as SigmaX
, count(a.X) as N
, sum(a.Y) as SigmaY
, sum(cast (a.X2 as decimal(38,8)) ) as SigmaX2
, sum(a.XY) as SigmaXY
, cast (SigmaX * SigmaX as decimal(38,12)) as SigmaX_2
, cast (SigmaX * SigmaY as decimal(38,12)) as SigmaXSigmaY
, SigmaXY- SigmaXSigmaY/N as SSXY
, SigmaX2- SigmaX_2/N as SSXX
, cast(SSXY/SSXX as decimal(38,12)) as b1
, SigmaY/N - b1*SigmaX/N as b0
from support_scratch.storage1 a
)WITH DATA PRIMARY INDEX (SigmaX) ;

--select * from support_scratch.storage2 ;
--delete from  support_scratch.storage3;
--drop table support_scratch.storage3;

create  table support_scratch.storage3 as
(select a.X
, a.TheDate
, a.Y
, cast(a.X*b1+b0 as decimal(18,2)) as Y1
, (Y1-Y)*(Y1-Y) as RSS
from support_scratch.storage1 a,
support_Scratch.storage2 b
where 1=1
)WITH DATA PRIMARY INDEX (X) ;

--delete from  support_scratch.storage4;
--drop table support_scratch.storage4;

create  table support_scratch.storage4 as
( select b1
, sqrt(x.RSS/SSXX) as SEb1
, b1 + 2 * SEb1 as b1CIR
, b1 - 2 * SEb1 as b1CIL
, b0
, sqrt(RSS*(1/N+SigmaX_2/(N*N*SigmaX2-N*SigmaX_2))) as SEb0
, b0 + 2 * SEb0 as b0CIR
, b0 - 2 * SEb0 as b0CIL
from support_scratch.storage2 b ,
( select sum(a.RSS) as RSS
from support_scratch.storage3 a
) x
where 1=1
)WITH DATA PRIMARY INDEX (b1) ;
CREATE TABLE support_scratch.cal_dt AS
(SELECT ROW_NUMBER() OVER(ORDER  BY b.cal_dt) AS RowNum,
b.cal_dt as TheDate
FROM access_views.DW_CAL_DT b
where b.age_for_month_id between -6 and 5
)WITH DATA PRIMARY INDEX (thedate) ;

--select * from support_scratch.cal_dt;

select  a.RowNum
, a.TheDate
, c.CurrentPermGB as Used_Capacity
, b.b1*a.RowNum+b.b0 as Storage_Forcast
, b.b1CIR*a.RowNum+b.b0CIR as "95% Confidence Interval R"
, b.b1CIL*a.RowNum+b.b0CIL as "95% Confidence Interval L"
from support_scratch.storage4 b,
support_scratch.cal_dt a
left join support_scratch.storage c
on a.TheDate=c.TheDate
where 1=1;
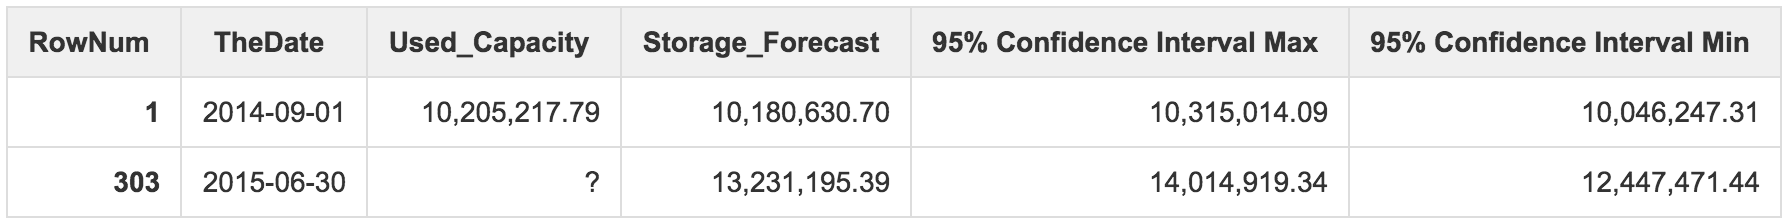
Output
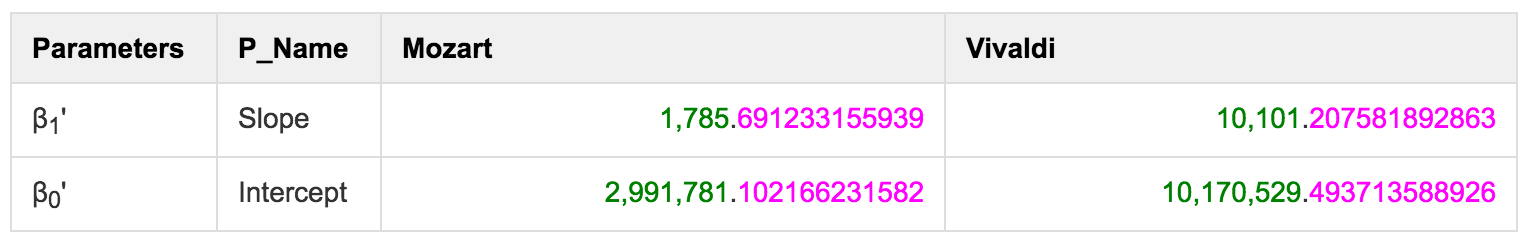
With these two parameters we can calculate the key point value and draw line in the dashboard.
Mozart
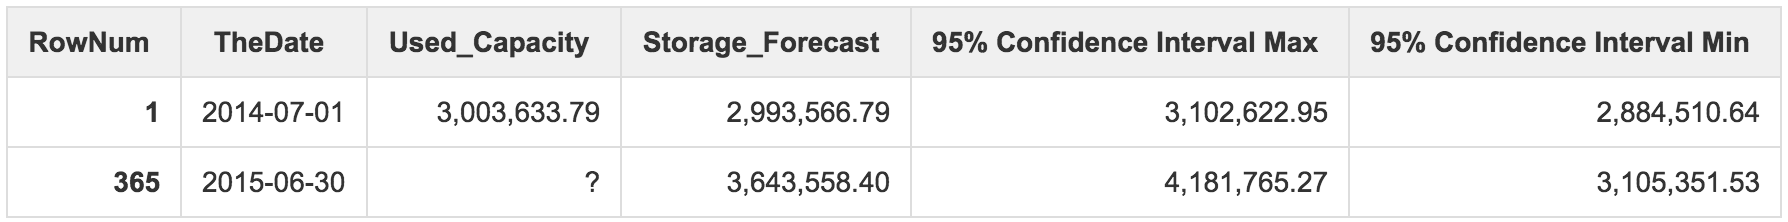
Vivaldi